YAS uses proprietary algorithms to project future performance for each draft prospect based on their physical characteristics and combine performance. This can help narrow down the prospects you can focus on in later rounds. How does it work? First, you start with the scouting, which tells you where that player is right now. If you are confident in his tape that he is an NFL starter RIGHT NOW, then stop, because you need not use our projections. For the other 800 prospects, some projection is necessary. That requires an understanding of their physical and mental abilities to play the position. We cannot grade the mentals (processing speed, intelligence, engagement, detail). However, we can grade how correlative their physical attributes to historical starting scores, and whether their traits give them room for error, or if they have to be perfect technicians to start.
What was our methodology? We took the measurements of each prospect for an eight-year rolling span, and correlated it with their actual NFL performance (as measured by Pro Football Focus, roughly). Those scores were adjusted with a bonus for how many plays they played each year, and those bonuses changed for each position. The formula for each position was adjusted until we found the right proportions of physical traits that roughly predicted future performance.
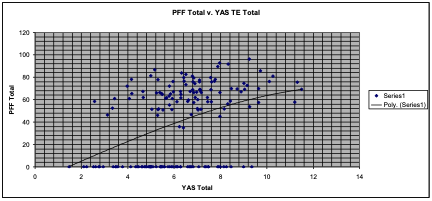
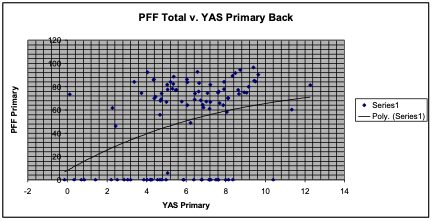
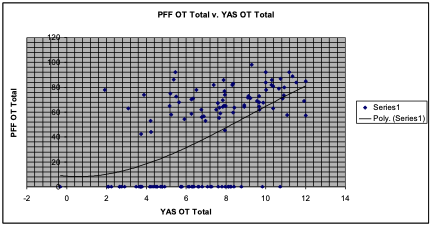
This chart compares the YAS score of every TE from 2015-2022 who completed enough drills to obtain a score (found on the X-axis), to their Pro Football Focus score (found on the Y-axis). Their PFF score is an average of their two best years (with enough snaps to qualify) with a bonus given for the number of snaps.
The dots at the bottom signify busts (players that have never played enough snaps to qualify for a score). As you can see, as you increase the YAS score, there are less busts. The bust rate at 7.2 YAS is 35%. The bust rate at 8.4 is 18%. In other words, you can use YAS to decrease your bust rate regardless of which round you are choosing a player. For the printouts, I have actually increased those bust rates to 45% and 28%, just to be safe.
This only takes into account players who (1) completed enough combine drills to qualify; and (2) were ever on a training camp roster; and (3) did not have their career cut short by injury or legal issues. Rookies are only included if their first year included sufficient snaps to qualify as a score. The trendline is computer generated, and takes into account the average PFF score relative to the YAS, taking into account the busts as zeros. The formulas are very different for each position. Some positions have less data points because lack of participants (Center), and some have less data points because most players do not complete all of the drills (RB).
YAS narrows down players with athletic traits that denote lower likelihoods of busting. You can narrow down your list to those with a YAS of 7.2 (one standard deviation off of mean) or 8.4 (two SD off of mean), or higher. You will miss out on some players with lower YAS scores that will eventually start. But, your bust rate will increase if you group all of the players with YAS scores below 7.2 into your evaluation pool. The benefit is getting to choose which 13 out of 20 players is likely to start, rather than picking which 17 out of 50 are likely to start.
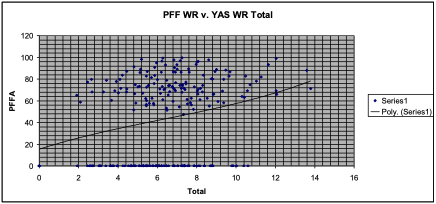
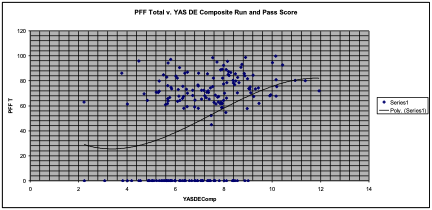
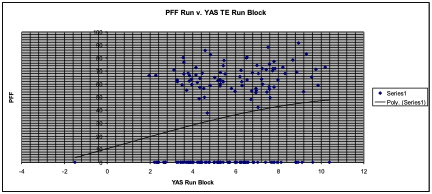
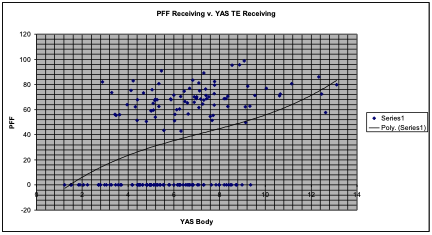
If you want to see how YAS Run and Receiving scores match up against PFF scores, here they are:
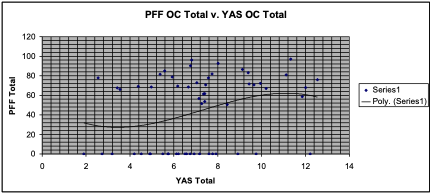
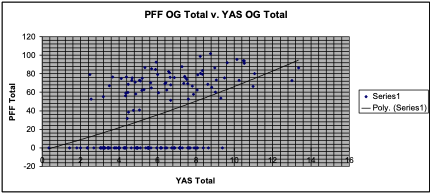
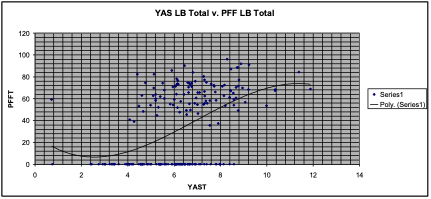
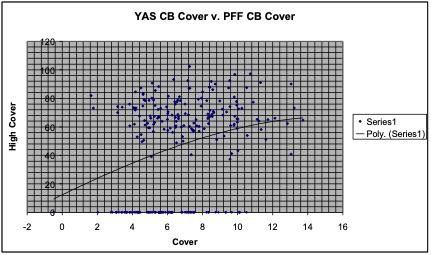
Here are the PFF v. YAS charts for the other positions we charted from 2015 to 2022.